AML Landscape: 957 Programs, 402 Targets, Opportunity Scored
Six validated targets attract intense competition yet account for only 16% of 957 programs. The remaining 65% scatter across 402 targets with limited clinical validation.

Download the Report
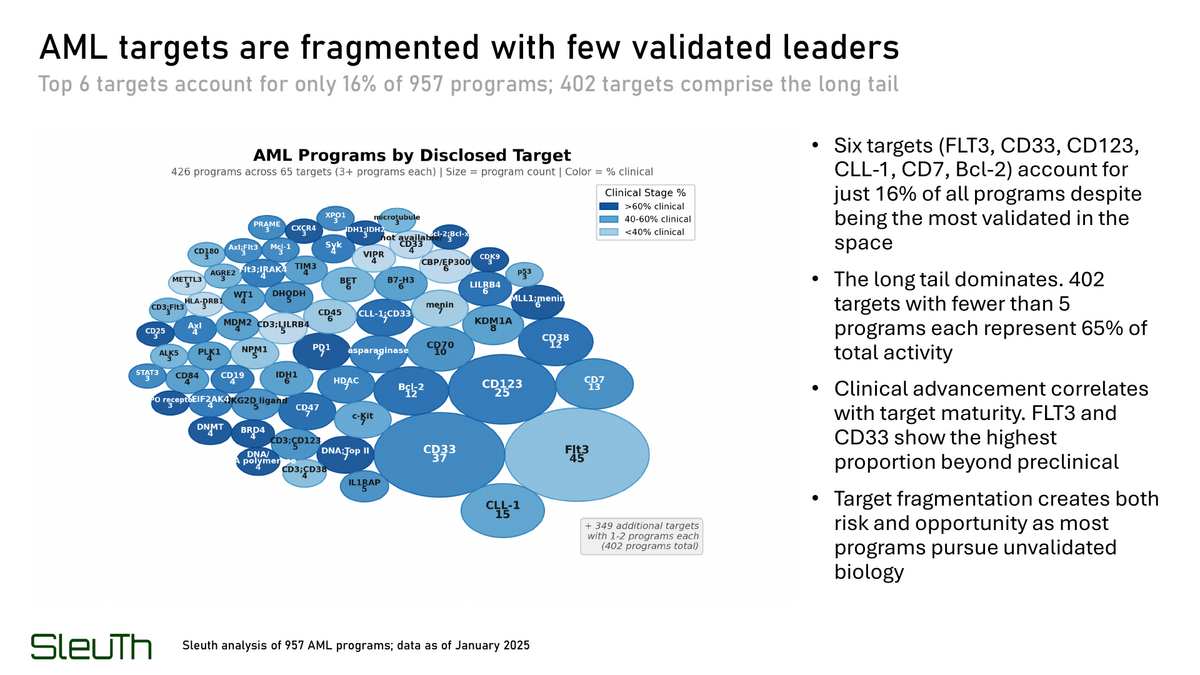
957 AML programs mapped across 402 disclosed targets. Six targets (FLT3, CD33, CD123, CLL-1, CD7, Bcl-2) account for just 16% of all programs despite being the most validated in the space. The long tail of 402 targets with fewer than 5 programs each represents 65% of total activity.
Selectivity is the core constraint. The most pursued AML targets overlap with normal hematopoiesis at the HSC or progenitor level, creating inherent on-target toxicity. Myelosuppression and cytopenias recur across modalities as a direct consequence.
Only 23% of programs support selectivity claims with protein-level data. Most rely on transcript evidence or inference, meaning the therapeutic window for many targets is assumed rather than demonstrated.
Cell therapy leads on volume (287 programs, 30%) but remains predominantly preclinical. Small molecules show the most balanced phase distribution, reflecting decades of development history. ADCs and antibody approaches cluster in early clinical stages.
Mitigation strategies diverge by modality. Cell therapies rely on lineage-restricted target selection (57%) and post-transplant timing (43%). Small molecules depend on split dosing (51%) and combination approaches (54%). 44% of small molecule programs cite no explicit mitigation strategy.
Targets with mature-restricted expression and low competitive intensity (LILRB4, PRAME, CD25, Siglec-6) remain underexplored. These represent opportunities for discovery approaches that resolve selectivity upfront rather than engineering around it downstream.
