Biotech Math: How the Blockbuster Model Drives Everything
How the blockbuster model impacts everything in the industry.

Download the Visual
Biotech Math (Pharma Edition)
Or, how the blockbuster model impacts everything in the industry
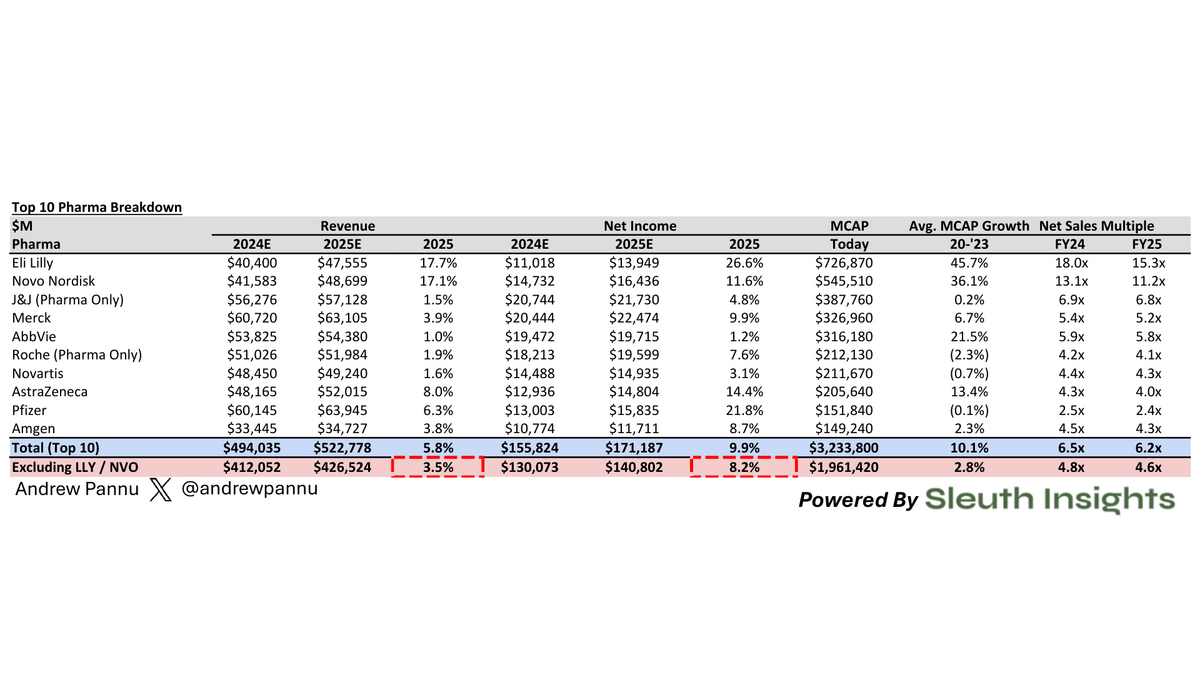
First, let's gather some data for the top 10 pharma companies [Fig 1]:
It's clear these businesses have incredible leverage: a 3.5% increase in revenue translates to a ~8% increase in net income. Said another way, after you pay for all the R&D, manufacturing and sales force costs, the best thing you can do is add more volume to that engine (hence pharma's bias to buy late-stage assets that bolt-on to existing infrastructure)
So, what is Pharma's hurdle rate for a drug to be worth the effort? Here's where I'll do some (directional) math. I'll exclude LLY / NVO from this analysis as outliers given the run-up with GLP-1 hype
$2T aggregate market cap x 7.5% target growth = +$150B
Some portion of that will come from existing assets that outperform - let's say 20%. That leaves the majority ($120B) to come from new assets
The FY25 multiple above (4.6x) is a blend of high-growth assets (new launches, acquisitions) and mature, slow-growing assets. The former is what will drive our remaining $120B gap, and those will command a higher multiple. How much higher should it be?
Looking at the revenue contribution of just high-growth assets (projected >=10% CAGR from 23-26), I'll back out an implied multiple of 9.1x by assuming a low (2x) multiple on mature asset sales [Fig 2]
As a gut check, this jives with the previously mentioned leverage that the Pharma model has and when applied to our $120B shortfall, we land at $13B in incremental revenue
But, we also need to factor in LOEs [Fig 3]
We see a crazy RR of $36B / year. However, this is a brutal period (Humira, Keytruda, etc.) Historically, the industry averaged ~$10B in LOEs / year, so let's lean that way and call it $15B. Adding that to our incremental revenue figure above gets us $28B
Lastly, looking at the recent history of FDA approvals implies about 10 launches a year [Fig 4]
So to bridge our $28B revenue gap, each asset would need to have peak sales potential of $2.8B / year. I use peak sales because that is a quick way to assess the commercial ceiling of new assets
So, what does this mean for the industry?
- It explains why Pharma focuses on mega-TAMs - once you factor in competition, they're the only spots you can get this type of scale their model demands
- When it comes to M&A; lots of SMID-cap companies are stuck in no-mans land (<$1B peak sales potential), which will not move the needle enough to justify an acquisition. SMID-caps in this range looking to get acquired by Pharma either need to cleanly fit an existing commercial structure or think about ways to add the necessary scale (i.e. merger of equals, etc.)
- Pharma is essentially deploying a venture style portfolio approach, which leaves lots of gaps for patients because the opportunity is not big enough; ideally these are captured by smaller companies who can cobble together enough scale to justify a takeout, or stay independent
